The article explains the purpose and structure of the income statement, detailing how it reports a company’s revenues, expenses, and net income over a period. It also discusses the single-step and multiple-step formats, their components, and how income statement information is used to assess profitability and predict future financial performance.
The income statement reports the results of a company’s operations—the sale of goods and services and the associated cost of operating the company—for a given period. The long-term survival of a company depends on its ability to produce net income by earning revenues in excess of expenses. Income enables a company to pay for the capital it uses (dividends to stockholders and interest to creditors) and attract new capital necessary for continued existence and growth. Investors buy and sell stock and creditors loan money based on their beliefs about a company’s future performance. The past income reported on a company’s income statement provides investors with information about a company’s ability to earn future income.
Elements of the Income Statement
The income statement consists of two major items:
- Revenues and gains
- Expenses and losses
An income statement for Microsoft is presented in Figure 1.
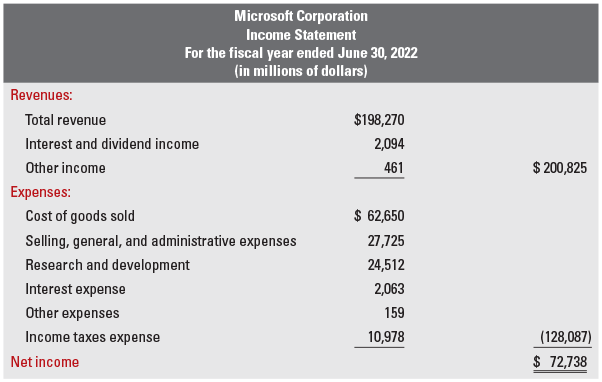
Figure 1. Income Statement Example
Examining the heading of the income statement, notice that it follows the same general format as the balance sheet—it indicates the name of the company, the title of the financial statement, and the time period covered by the statement. However, the income statement differs from the balance sheet in that it covers a period of time instead of a specific date.
Revenues and Gains
Revenues are the increase in net assets that result from the sale of products or services. Revenues can arise from different sources and have different names depending on the source of the revenue. Sales revenue (or service revenue for companies that provide services) arises from the principal activity of the business. For Microsoft, its sales revenue comes from sales of hardware (such as PCs, tablets, and gaming consoles), software (operating systems), cloud-based solutions, and peripheral products and accessories. Microsoft, like most other companies, recognizes sales revenue when it satisfies its obligation to its customer by transferring goods or performing services. This normally happens in the period that a sale occurs.
Similar to revenues, gains are increases in net assets. However, gains occur from transactions that do not involve the sale of products or services. For example, Microsoft may recognize a gain when it sells one of its buildings
Expenses and Losses
Expenses are the cost of resources used to earn revenues during a period. Expenses have different names depending on their function. Five common expenses generally found on an income statement include:
- Cost of goods sold (often called cost of sales)—the cost to the seller of all goods sold during the accounting period.
- Selling, general, and administrative expenses—the expenses that a company incurs in selling goods, providing services, or managing the company that are not directly related to production. These expenses include advertising expenses; salaries paid to salespersons or managers; depreciation on administrative buildings; and expenses related to insurance, utilities, property taxes, and repairs.
- Research and development expense—the cost of developing new products.
- Interest expense—expense incurred as a result of borrowing money from creditors. Interest is often referred to as the time value of money.
- Income taxes expense—the income taxes paid on the company’s pretax income.
Similar to expenses, losses are decreases in net assets. However, losses occur from transactions that do not involve the sale of products or services. For example, a company may suffer a loss from flood damage.
Net Income
Net income, or net earnings, is the difference between total revenues and expenses. Microsoft reported net income of $72,738 million ($200,825 million – $128,087 million). If total expenses are greater than total revenues, the company would report a net loss.
Income Statement Formats
Companies prepare their income statements in one of two different formats: single-step income statements or multiple-step income statements.
Single-Step Income Statement
In a single-step income statement, there are only two categories: total revenues and total expenses. Total expenses are subtracted from total revenues in a single step to arrive at net income. The advantage of a single-step income statement is its simplicity.
Preparing a Single-Step Income Statement
The preparation of a single-step income statement involves four steps:
Step 1.
Prepare a heading that includes the name of the company, the title of the financial statement, and the time period covered.
Step 2.
List the revenues of the company, starting with sales revenue (or service revenue) and then listing other revenue items. Add the revenues to get total revenue.
Step 3.
List the expenses of the company, usually starting with cost of goods sold. Add the expenses to get total expenses.
Step 4.
Subtract the expenses from the revenues to get net income (or net loss if expenses exceed revenues). Double-underline net income.
In general, only the first items in a column as well as any subtotals or totals have dollar signs. Also, when multiple items exist within a classification, these items are grouped together in a separate column (to the left of the main column) and their total is placed in the main column. Example 1 shows how to prepare a single-step income statement.
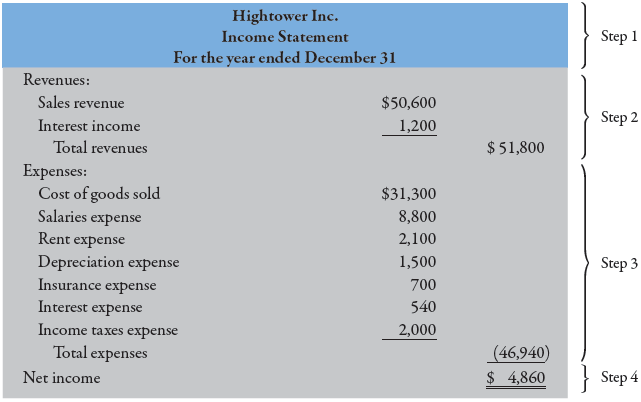
Example 1 Preparing a Single-Step Income Statement
The income statement reports the results of a company’s operations (revenues minus expenses) for a given period of time.
Information:
Hightower Inc. reported the following account balances for the year ending December 31:
| Cost of goods sold | $31,300 | Interest expense | $ 540 |
| Salaries expense | 8,800 | Sales revenue | 50,600 |
| Insurance expense | 700 | Depreciation expense | 1,500 |
| Interest income | 1,200 | Rent expense | 2,100 |
| Income taxes expense | 2,000 |
Prepare a single-step income statement for Hightower for the year ending December 31.
Multiple-Step Income Statement
A second income statement format is the multiple-step income statement. The multiple-step income statement organizes revenues and expenses into multiple categories. The resulting subtotals highlight important relationships between revenues and expenses that financial statement users find useful. A multiple-step income statement contains three important subtotals: gross margin, income from operations, and net income. A multiple-step income statement for Microsoft is shown in Figure 2.
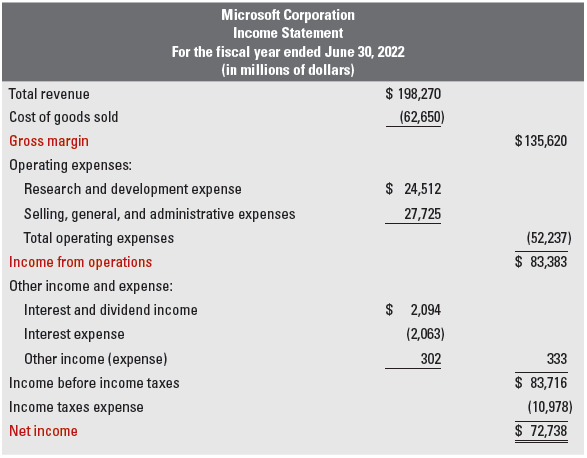
Figure 2. Multiple-Step of Income Statement Example
Gross Margin
A company’s gross margin (or gross profit) is calculated as:
Gross Margin = Net Sales – Cost of Goods Sold
Gross margin represents the initial profit made from selling a product, but it is not a measure of total profit because other operating expenses have not yet been subtracted. However, gross margin is closely watched by managers and other financial statement users. A change in a company’s gross margin can give insights into a company’s current pricing and purchasing policies, thereby providing insight into the company’s future performance.
Income from Operations
Income from operations (or operating income) is computed as:
Income from Operations = Gross Margin – Operating Expenses
Operating expenses
The business incurs in selling goods or providing services and managing the company. Operating expenses typically include research and development expenses, selling expenses, and general and administrative expenses. Income from operations indicates the level of profit produced by the principal activities of the company. A company can increase its income from operations by either increasing its gross margin or decreasing its operating expenses.
Nonoperating Activities
A multiple-step income statement reports nonoperating activities. Which is frequently called other income and expenses. Nonoperating activities are revenues and expenses from activities other than the company’s principal operations. They include gains and losses from the sale of equipment and other items that were not acquired for resale. For many companies, the most important nonoperating item is interest and investment income. Figure 3 lists some common nonoperating items.
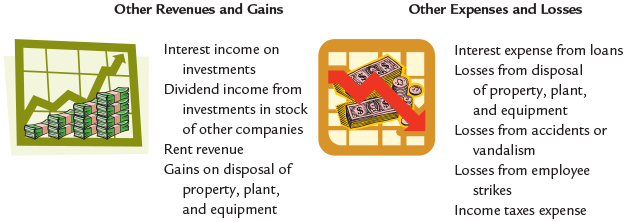
Figure 3. Typical Nonoperating Items
Net Income
Nonoperating items are subtracted from income from operations to obtain income before taxes. Income taxes expense is then subtracted to obtain net income. Regardless of whether a single-step or multiple-step format is used, notice that there is no difference in the amount of the revenue or expense items reported. That is, net income is the same under either format. The only difference is how the revenues and expenses are classified.
Preparing a Multiple-Step Income Statement
The preparation of a multiple-step income statement involves five steps:
Step 1.
Prepare a heading that includes the name of the company, the title of the financial statement, and the time period covered.
Step 2.
Compute gross profit as the difference between net sales and cost of goods sold.
Step 3.
Compute income from operations by subtracting operating expenses from gross profit.
Step 4.
Compute income before income taxes by subtracting nonoperating activities from income from operations.
Step 5.
Compute net income (or net loss) by subtracting income taxes expense from income before income taxes. Double-underline net income.
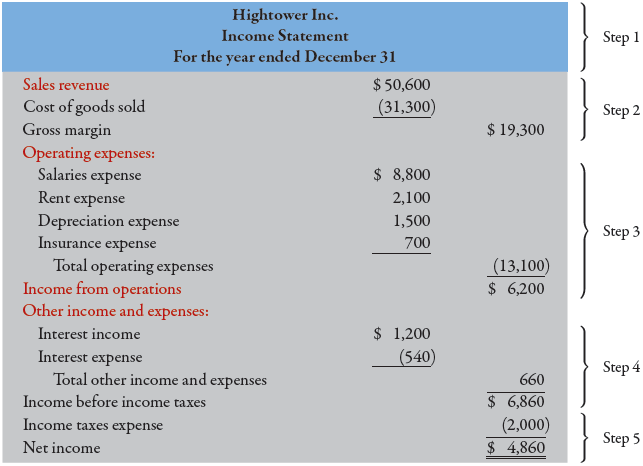
Example 2 Preparing a Multiple-Step Income Statement
The multiple-step income statement reports the results of a company’s operations, with revenues and expenses organized into multiple categories to highlight important relationships.
Information:
Hightower Inc. reported the following account balances for the year ending December 31:
| Cost of goods sold | $31,300 | Interest expense | $ 540 |
| Salaries expense | 8,800 | Sales revenue | 50,600 |
| Insurance expense | 700 | Depreciation expense | 1,500 |
| Interest income | 1,200 | Rent expense | 2,100 |
| Income taxes expense | 2,000 |
Prepare a multiple-step income statement for Hightower for the year ending December 31.
Using Income Statement Information
A company’s ability to generate current income is useful in predicting its ability to generate future income. When investors believe that future income will improve, they will buy stock. Similarly, creditors rely on their judgments of a company’s future income to make loans. Investors and creditors’ estimate of the future profitability and growth of a company are aided by a careful examination of how a company has earned its revenue and managed its expenses.
Net Profit Margin
A useful measure of a company’s ability to generate profit is its net profit margin (sometimes called return on sales). Net profit margin shows the percentage of profit in each dollar of sales revenue (or service revenue) and is computed as:
$$\textrm{Net Profit Margin}=\frac{\textrm{Net Income}}{\textrm{Sales(or Services)Revenue}}$$
This ratio provides an indication of management’s ability to control expenses. Future income depends on maintaining (or increasing) market share while controlling expenses.
Assessing Future Profitability
Invest in one of two companies in the same industry—Graebel Inc. or Stanley Company. Your initial examination revealed that both companies reported the same amount of net income for 2027. Further analysis produced the following 5-year summary:
| Graebel Inc. | |||||
| 2023 | 2024 | 2025 | 2026 | 2027 | |
| Sales revenue | $ 625,000 | $ 750,000 | $ 820,000 | $ 920,000 | $ 1,000,000 |
| Net income | $ 30,000 | $ 36,000 | $ 40,000 | $ 45,000 | $ 50,000 |
| Profit margin | 4.8% | 4.8% | 4.9% | 4.9% | 5.0% |
| Stanley Company | |||||
| 2023 | 2024 | 2025 | 2026 | 2027 | |
| Sales revenue | $1,025,000 | $ 975,000 | $ 940,000 | $ 1,020,000 | $ 1,040,000 |
| Net income | $ 51,000 | $ 48,000 | $ 46,000 | $ 49,000 | $ 50,000 |
| Profit margin | 5% | 4.9% | 4.9% | 4.8% | 4.8% |
Which company is the better investment?
Investors seek those investments that will provide the largest return at the lowest risk. One factor associated with large returns is future profitability. Over the last 5 years, Graebel’s sales and net income have steadily increased while Stanley’s sales and net income have remained, on average, stable. Sales growth is an indicator of the possibility of increasing future income. Further, Graebel’s increasing profit margin (compared to a decreasing profit margin for Stanley) indicates that Graebel is doing a better job at controlling its expenses relative to Stanley, enabling Graebel to earn more profit on each dollar of sales. While the future never can be predicted with certainty, the data suggest that, if current trends continue, Graebel will grow more rapidly than Stanley. Therefore, an investment in Graebel would probably yield the larger future return. Accounting information can help you judge a company’s potential for future profitability and growth.
Key Takeaways
The income statement is a vital financial tool that provides insights into a company’s profitability, operational efficiency, and overall financial performance. By analyzing revenues, expenses, and net income, investors, managers, and creditors can assess how effectively a business generates profit and controls costs. Understanding income statement formats and metrics—such as gross margin, operating income, and net profit margin—enables stakeholders to make informed decisions regarding investments, creditworthiness, and strategic planning. In practical applications, this statement serves as a foundation for evaluating future profitability, guiding management actions, and ensuring the long-term sustainability of a business.