This article explains how investors use financial statements to evaluate equity performance and stockholder returns, focusing on profitability ratios such as return on common equity and earnings per share (EPS), as well as payout measures including dividend yield, dividend payout, and stock repurchase payout. It also discusses how companies manage stock options and repurchase shares to avoid earnings dilution while balancing shareholder value and corporate strategy.
Stockholders want to understand the following:
- how the value of their shares of stock will change
- how the company will distribute any excess cash to stockholders
We all know that investors buy stock to increase their personal wealth. But how do stockholders use the financial statements to better understand these two dimensions?
Stockholder Profitability Ratios
A primary driver of an increase in stock price is profitability. Profitability refers to the return that the company earns (in other words, its net income). However, the magnitude of the net income also matters because it shows how much had to be invested to earn the return. That is, would you rather earn $10 on a $100 investment or $20 on a $500 investment? Although the latter return is twice as large as the former, it also took an investment that was five times bigger. Assuming equal risk, etc., most investors would prefer to invest $100 to earn $10 because they then could use the extra $400 to invest somewhere else.
The two most common ratios used to evaluate stockholder profitability are return on common equity and earnings per share (EPS).
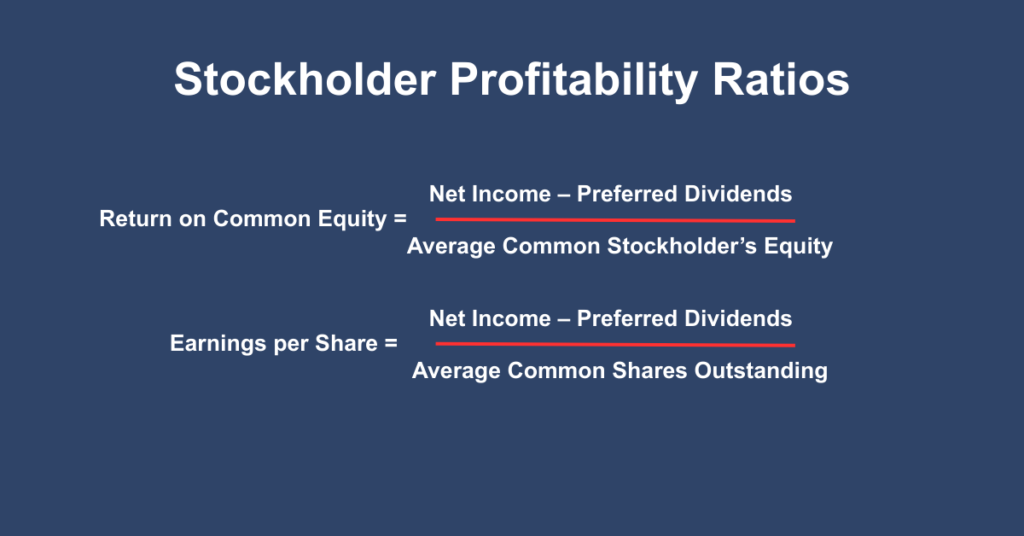
Figure. Stockholder Profitability Ratios
Return on Common Equity
Return on common equity shows the growth in equity from operating activities. It is calculated as:
$$\textrm{Return on Common Equity}=\frac{\textrm{Net Income – Preferred Dividends}}{\textrm{Average Common Stockholder’s Equity}}$$
Common stockholders’ equity is calculated by taking total stockholders’ equity and subtracting preferred stock.
Earnings per Share (EPS)
Earnings per share (EPS) measures the net income earned by each share of common stock. It is calculated as:
$$\textrm{EPS}=\frac{\textrm{Net Icome – Preferred Dividends}}{\textrm{Average Common Shares Outstanding}}$$
Example 1 Calculating Stockholder Profitability Ratios
Investors are interested in the returns on their equity investment.
Information:
Consider the following information from Kroger’s Fiscal 2022 financial statements (all numbers in millions other than per-share amounts).
| Common stock price (yearend) | $45.05/share | Avg. common shares outstanding | 718 |
| Common dividends | $709 | Dividends per common share | $0.00/share |
| Preferred dividends | $0 | Net income (attributable to common | |
| Ending preferred stock | $0 | shareholders) | $2,244 |
| Ending total stockholders’ equity | $10,014 | Beginning preferred stock | $0 |
| Purchases of treasury stock | $821 | Beginning total stockholders’ equity | $9,429 |
Required:
Calculate the following stockholder profitability ratios: (1) return on common equity and (2) EPS. When calculating EPS for Kroger, you need to subtract $20 from Net Income. This amount is the combined distributed and undistributed earnings to participating securities as mentioned in the Earnings per Common Share footnote (Note 10). Such adjustments are very unusual, but in this case is necessary to calculate the EPS as shown on the Income Statement. Ignore this adjustment when calculating the other ratios.
Solution:
- $$\textrm{Return On Common Equity}=\frac{\textrm{Net Income – Preferred Dividends}}{\textrm{Average Common Stakeholder’s Equity Outstanding}} =\frac{(2,244-0)}{\left [ (9,429-0)- (10,14-0)\right]\div 2}=23.08%$$
- $$\textrm{EPS}=\frac{\textrm{Net Income – Preferred Divivdends}}{\textrm{Average Common Share Outstanding}}=\frac{((2,244-20)-0)}{718}=3.10$$
Stockholder Payout
Stockholders not only experience an increase in wealth through an increasing stock price, but may also receive cash, or a payout, from the company. The most common stockholder payout ratios relate to dividends. Dividend yield considers the ratio of dividends paid to stock price. This ratio is conceptually similar to an interest rate for debt:
$$\textrm{Dividend Yield}=\frac{\textrm{Dividends Per Common Share}}{\textrm{Closing Market Price per Share for the Year}}$$
Another common dividend ratio calculates the proportion of dividends to earnings:
$$\textrm{Dividend Payout}=\frac{\textrm{Common Dividends}}{\textrm{Net Income}}$$
However, as discussed earlier, payouts to stockholders can also take the form of stock repurchases. As such, the stock repurchase payout ratio is:
$$\textrm{Stock Repurchase Payout}=\frac{\textrm{Common Stock Repurchases}}{\textrm{Net Income}}$$
By using these two ratios, stockholders can easily calculate the total payout:
$$\textrm{Total Payout}=\textrm{Divivdend Payout}+\textrm{Stock Repurchase Payout}$$
Or, it can be calculated directly as:
$$\textrm{Total Payout}=\frac{\textrm{Common Dividends}+ \textrm{Common Stock Repurchases}}{\textrm{Net Income (or Comprehensive Income)}}$$
Example 2 Calculating Stockholder Payout Ratios
Investors are interested in the company payouts to shareholders through dividends and/or stock repurchases.
Information:
Consider the following information from Kroger’s Fiscal 2022 financial statements (all numbers in millions other than per-share amounts).
| Common stock price (yearend) | $45.05/share | Avg. common shares outstanding | 718 |
| Common dividends | $709 | Dividends per common share | $0.99/share |
| Preferred dividends | $0 | Net income (attributable to common | |
| Ending preferred stock | $0 | shareholders) | $2,244 |
| Ending total stockholders’ equity | $10,014 | Beginning preferred stock | $0 |
| Purchases of treasury stock | $821 | Beginning total stockholders’ equity | $9,429 |
Required:
Calculate the following stockholder payout ratios: (1) dividend yield, (2) dividend payout, (3) stock repurchase payout, and (4) total payout.
Solution:
- $$\textrm{Dividend Yield}=\frac{\textrm{Dividends per Common Share}}{\textrm{Common Stock price(year end)}}=\frac{0.99}{45.05}=2.20%$$
- $$\textrm{Dividend Payout}=\frac{\textrm{Common Dividends}}{\textrm{Net Income}}=\frac{709}{2,244}=31.60%$$
- $$\textrm{Stock Repurchase Payout}=\frac{\textrm{Common Stock Repurchases}}{\textrm{Net Income}}=\frac{821}{2,244}=36.59%$$
- $$\textrm{Total Payout}=\textrm{Dividend Payout+Stock Repurchase Payout}=31.60+36.59%=68.19%$$
Note: This can also be calculated directly as (Dividends + Stock Repurchases) ÷ Net Income.
Interpreting Ratios
What do these stockholder profitability and payout ratios mean? The results of these ratios are usually used in two ways:
- Compared over time to evaluate trends: For example, in Fiscal 2022 (hereafter, fiscal years will be referred to by the year alone) Kroger’s EPS was $3.10. This might be great news if EPS in 2021 were $1.15 or bad news if it were $4.25. In fact, EPS for 2020 and 2021 were $3.31 and $2.20, respectively. This means EPS increased by about 41% in 2022, but that increase still falls below EPS in 2020. 2020 was obviously an unusual year due to COVID-19. It is plausible that 2020 EPS was unusually high because restaurants were closed and people were eating at home. Regardless of your theory, these changes are significant and worth investigating further.
- Compared to results for other companies in the industry: For example, the 2022 return on common equity for Kroger was 23.08% and for Sprouts Farmers Market it was 26.03%. This makes Kroger’s return on common equity look a little subpar. You can also look at industry averages. Reuters reports an industry average of 24.82%, so Kroger is slightly behind the industry average.
Providing Shares for Employee Stock Options
You are the CFO of DTR Technology, a small, publicly traded software firm. Your stock price has increased by 120% over the last 2 years and is now at $22 per share. Of course, this is great news. However, one side effect is that DTR employees own approximately 750,000 stock options with an average exercise price of $5 per share.
What factors must be considered in handling the anticipated exercise of these options?
DTR could issue previously unissued shares and take in the exercise price, or $3,750,000 in total (750,000 × $5). Although this seems reasonable, very few companies follow this course of action. Instead, most companies engage in a stock repurchase plan. For example, Microsoft repurchased 95 million shares of stock in 2022 costing approximately $28.0 billion, at least partly because of their employee stock compensation plans. This is despite the fact that Microsoft stock closed fiscal year 2022 at $239.82, while the average exercise price of the nonvested options was $227.59. In other words, if Microsoft planned to buy back shares of stock for $239.82 per share while only receiving $227.59 per option exercised, they will lose $12.23 per share.
Why does Microsoft buy back shares to either give away or sell at below market prices to employees when they could simply issue new shares? Microsoft, like most companies, chose to repurchase shares because issuing previously unissued shares will increase the number of shares outstanding, which will, in turn, decrease (or dilute) earnings per share.
For DTR, repurchasing shares on the open market to cover its 750,000 in options would cost $12,750,000 [750,000 options × ($22 − $5)], but would prevent earnings per share from being diluted.
Key Takeaways
Understanding equity performance measures and stockholder return metrics is essential for both investors and corporate decision-makers because these tools translate financial statement data into practical insights about profitability, efficiency, and long-term value creation. Ratios such as return on common equity and earnings per share help investors assess how effectively a company generates profits from shareholders’ funds, while dividend yield, payout ratios, and stock repurchase strategies reveal how those profits are distributed. In real-world applications, these metrics guide investment decisions, support valuation analysis, influence capital allocation strategies, and help management balance growth with shareholder returns. By applying these measures consistently, stakeholders can make more informed financial decisions, reduce risk, and better evaluate a company’s sustainable performance over time.